Chapter 13. Drawing Basic Shapes
This chapter contains an assortment of basic shape creation examples, including the following:
simple shapes: line, ellipse, rectangle, text;
shape fills: solid, gradients, hatching, bitmaps;
an OLE shape (a math formulae);
polygons, multiple lines, partial ellipses.
The examples come from two files, Draw Picture and Animate Bike. The show() function of draw_picture.py:
class DrawPicture:
    def show(self) -> None:
        loader = Lo.load_office(Lo.ConnectPipe())

        try:
            doc = DrawDoc(Draw.create_draw_doc(loader))
            doc.set_visible()
            Lo.delay(1_000)  # need delay or zoom may not occur
            doc.zoom(ZoomKind.ENTIRE_PAGE)

            curr_slide = doc.get_slide(idx=0)
            self._draw_shapes(curr_slide=curr_slide)

            s = curr_slide.draw_formula(
                formula="func e^{i %pi} + 1 = 0",
                x=70,
                y=20,
                width=75,
                height=40,
            )
            # Draw.report_pos_size(s)

            self._anim_shapes(curr_slide=curr_slide)

            s = curr_slide.find_shape_by_name("text1")
            Draw.report_pos_size(s.component)

            Lo.delay(2000)
            msg_result = MsgBox.msgbox(
                "Do you wish to close document?",
                "All done",
                boxtype=MessageBoxType.QUERYBOX,
                buttons=MessageBoxButtonsEnum.BUTTONS_YES_NO,
            )
            if msg_result == MessageBoxResultsEnum.YES:
                doc.close_doc()
                Lo.close_office()
            else:
                print("Keeping document open")
        except Exception:
            Lo.close_office()
            raise
draw_picture.py creates a new Draw document, and finishes by displaying a Class MsgBox shown in Fig. 104 asking the user if they want to close the document.
msg_result = MsgBox.msgbox(
    "Do you wish to close document?",
    "All done",
    boxtype=MessageBoxType.QUERYBOX,
    buttons=MessageBoxButtonsEnum.BUTTONS_YES_NO,
)
if msg_result == MessageBoxResultsEnum.YES:
    doc.close_doc()
    Lo.close_office()
else:
    print("Keeping document open")

Fig. 104 :Message Box - All Done
Draw.create_draw_doc() is a wrapper around Lo.create_doc() to create a Draw document:
# in the Draw class
@staticmethod
def create_draw_doc(loader: XComponentLoader) -> XComponent:
    return Lo.create_doc(doc_type=Lo.DocTypeStr.DRAW, loader=loader)
# in the Draw class
@staticmethod
def create_impress_doc(loader: XComponentLoader) -> XComponent:
    return Lo.create_doc(doc_type=Lo.DocTypeStr.IMPRESS, loader=loader)
13.1 Drawing Shapes
The _draw_shapes() method inside draw_picture.py draws the six shapes shown in Fig. 105.

Fig. 105 :The Six Shapes Drawn by _draw_shapes().
Almost every Draw method call Draw.make_shape() which creates a shape instance and sets its size and position on the page:
# in the Draw class (simplified)
@staticmethod
def make_shape(
    shape_type: DrawingShapeKind | str,
    x: int | UnitT,
    y: int | UnitT,
    width: int | UnitT,
    height: int | UnitT,
) -> XShape:

    # parameters are in mm units
    shape = Lo.create_instance_msf(XShape, f"com.sun.star.drawing.{shape_type}", raise_err=True)
    shape.setPosition(Point(x * 100, y * 100))
    shape.setSize(Size(width * 100, height * 100))
    return shape
See also
The method assumes that the shape is defined inside the com.sun.star.drawing package, i.e. that it’s a shape which
subclasses com.sun.star.drawing.Shape, like those in Fig. 96.
The code converts the supplied (x, y) coordinate, width, and height from millimeters to Office’s 1/100 mm values.
The exact meaning of the position and the size of a shape is a little tricky. If its width and height are positive, then the position is the top-left corner of the rectangle defined by those dimensions. However, the user can supply negative dimensions, which means that “top-left corner” may be on the right or bottom of the rectangle (see Fig. 106 (a)). Office handles this by storing the rectangle with a new top-left point, so all the dimensions can be positive (see Fig. 106 (b)).
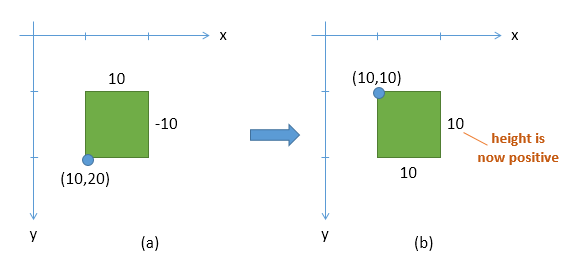
Fig. 106 :How Office Stores a Shape with a Negative Height.
This means that your code should not assume that the position and size of a shape remain unchanged after being set with XShape.setPosition() and XShape.setSize().
make_shape() is called by Draw.add_shape() which adds the generated shape to the page.
It also check if the (x, y) coordinate is located on the page. If it isn’t, Draw.warns_position() prints a warning message.
# in the Draw class (simplified)
@classmethod
def add_shape(
    cls,
    slide: XDrawPage,
    shape_type: DrawingShapeKind | str,
    x: int | UnitT,
    y: int | UnitT,
    width: int | UnitT,
    height: int | UnitT,
) -> XShape:

    cls.warns_position(slide=slide, x=x, y=y)
    shape = cls.make_shape(shape_type=shape_type, x=x, y=y, width=width, height=height)
    slide.add(shape)
    return shape
See also
_draw_shapes() in the draw_picture.py example is shown below. It creates the six shapes shown in Fig. 105.
def _draw_shapes(self, curr_slide: DrawPage[DrawDoc]) -> None:
    line1 = curr_slide.draw_line(x1=50, y1=50, x2=200, y2=200)
    line1.component.LineColor = CommonColor.BLACK
    line1.set_dashed_line(is_dashed=True)

    # red ellipse; uses (x, y) width, height
    circle1 = curr_slide.draw_ellipse(x=100, y=100, width=75, height=25)
    circle1.component.FillColor = CommonColor.RED

    # rectangle with different fills; uses (x, y) width, height
    rect1 = curr_slide.draw_rectangle(x=70, y=100, width=75, height=25)
    rect1.component.FillColor = CommonColor.LIME

    text1 = curr_slide.draw_text(
        msg="Hello LibreOffice",
        x=120,
        y=120,
        width=60,
        height=30,
        font_size=24,
    )
    text1.component.Name = "text1"
    # Props.show_props("TextShape's Text Properties", Draw.get_text_properties(text1.component))

    # gray transparent circle; uses (x,y), radius
    circle2 = curr_slide.draw_circle(x=40, y=150, radius=20)
    circle2.component.FillColor = CommonColor.GRAY
    circle2.set_transparency(level=Intensity(25))

    # thick line; uses (x,y), angle clockwise from x-axis, length
    line2 = curr_slide.draw_polar_line(x=60, y=200, degrees=45, distance=100)
    line2.component.LineWidth = 300
There’s a number of variations possible for each shape. The following sections look at how the six shapes are drawn.
13.2 A Black Dashed Line
Draw.draw_line() calls Draw.add_shape() to create a com.sun.star.drawing.LineShape instance.
In common with other shapes, a line is defined in terms of its enclosing rectangle, represented by its top-left corner, width, and height.
Draw.draw_line() allows the programmer to define the line using its endpoints:
# in the Draw class
@classmethod
def draw_line(cls,
    slide: XDrawPage,
    x1: int | UnitT,
    y1: int | UnitT,
    x2: int | UnitT,
    y2: int | UnitT
    ) -> XShape:
    # make sure size is non-zero
    if (x1 == x2) and (y1 == y2):
        raise ValueError("Cannot create a line from a point")

    width = x2 - x1  # may be negative
    height = y2 - y1  # may be negative
    return cls.add_shape(
        slide=slide,
        shape_type=DrawingShapeKind.LINE_SHAPE,
        x=x1,
        y=y1,
        width=width,
        height=height,
    )
As mentioned above, Office will store a shape with a modified position and size if one or both of its dimensions is negative.
As an example, consider if Draw.draw_line() is called with the coordinates (10,20) and (20,10).
The call to Draw.add_shape() would be passed a positive width (10mm) and a negative height (-10mm).
This would be drawn as in Fig. 107 (a) but would be stored using the shape position and size in Fig. 107 (c).
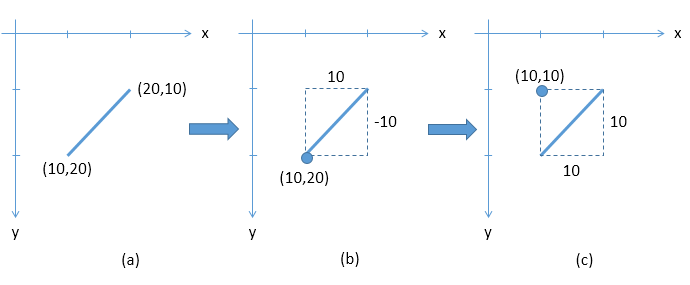
Fig. 107 :How a Line with a Negative Height is Stored as a Shape.
This kind of transformation may be important if your code modifies a shape after it has been added to the slide, as my animation examples do in the next chapter.
Back in draw_picture.py’s _draw_shapes(), the line’s properties are adjusted.
The hardest part of this is finding the property’s name in the API documentation, because properties are typically defined across multiple services,
including LineShape, Shape, FillProperties, ShadowProperties, LineProperties, and RotationDescriptor.
If the property is related to the shape’s text then you should check TextProperties, CharacterProperties, and ParagraphProperties as well.
Fig. 97 shows the situation for RectangleShape, and its much the same for other shapes.
You should start looking in the documentation for the shape ( i.e. use lodoc LineShape drawing ), and move up the hierarchy.
Tip
There is a List of all members link on the top right side of all API pages.
You can click on the inheritance diagram at the top of the page ( e.g. like the one in Fig. 108 ) to look in the different services.
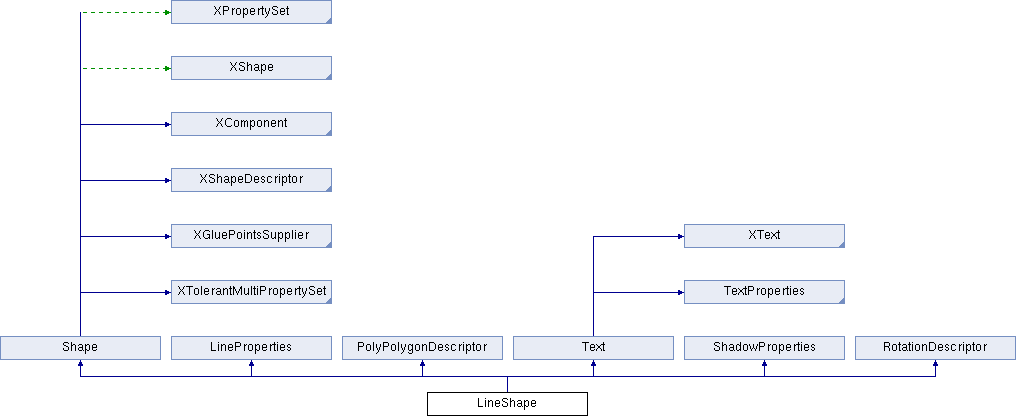
Fig. 108 :The LineShape Inheritance Diagram in the LibreOffice Online Documentation.
_draw_shapes() will color the line black and make it dashed, which suggests that I should examine the LineProperties class.
Its relevant properties are LineColor for color and LineStyle and LineDash for creating dashes, as in Fig. 109.

Fig. 109 :Relevant Properties in the LineProperties Class.
line1.component is a LineShape so it can be used to set the line color, line dashing is set using shapes.LineShape.set_dashed_line():
# in _draw_Shapes()
line1.component.LineColor = CommonColor.BLACK
line1.set_dashed_line(is_dashed=True)
See also
shapes.LineShape.set_dashed_line() invokes Draw.set_dashed_line() to assign a LineStyle object to LineStyle and a LineDash object to LineDash.
The line style is easily set since LineStyle is an enumeration with three possible values. A LineDash object requires more work:
# in Draw class (simplified)

from ooo.dyn.drawing.line_dash import LineDash as LineDash
from ooo.dyn.drawing.line_style import LineStyle as LineStyle

@staticmethod
def set_dashed_line(shape: XShape, is_dashed: bool) -> None:

    props = Lo.qi(XPropertySet, shape, True)
    if is_dashed:
        ld = LineDash() #  create new struct
        ld.Dots = 0
        ld.DotLen = 100
        ld.Dashes = 5
        ld.DashLen = 200
        ld.Distance = 200
        props.setPropertyValue("LineStyle", LineStyle.DASH)
        props.setPropertyValue("LineDash", ld)
    else:
        # switch to solid line
        props.setPropertyValue("LineStyle", LineStyle.SOLID)
set_dashed_line() can be used to toggle a line’s dashes on or off.
Note
Draw class import may enums and structures from ooouno package, including LineDash and LineStyle.
At runtime their values and constants are identical to uno's. The advantage is there is a little magic taking place under the
hood with ooouno imports in the dyn namespace. They behave like python objects without the uno limitations.
See also
13.3 A Red Ellipse
A red ellipse is drawn using:
# in _draw_Shapes()
circle1 = curr_slide.draw_ellipse(x=100, y=100, width=75, height=25)
circle1.component.FillColor = CommonColor.RED
curr_slide.draw_ellipse() invokes Draw.draw_ellipse() and is similar to Draw.draw_line() except that an EllipseShape is created by Draw.add_shape():
# in Draw class (simplified)
@classmethod
def draw_ellipse(cls, slide: XDrawPage, x: int, y: int, width: int, height: int) -> XShape:
    return cls.add_shape(
        slide=slide, shape_type=DrawingShapeKind.ELLIPSE_SHAPE, x=x, y=y, width=width, height=height
    )
The circle needs to be filled with a solid color, which suggests the setting of a property in FillProperties. A visit to the online documentation for EllipseShape reveals an inheritance diagram like the one in Fig. 110.
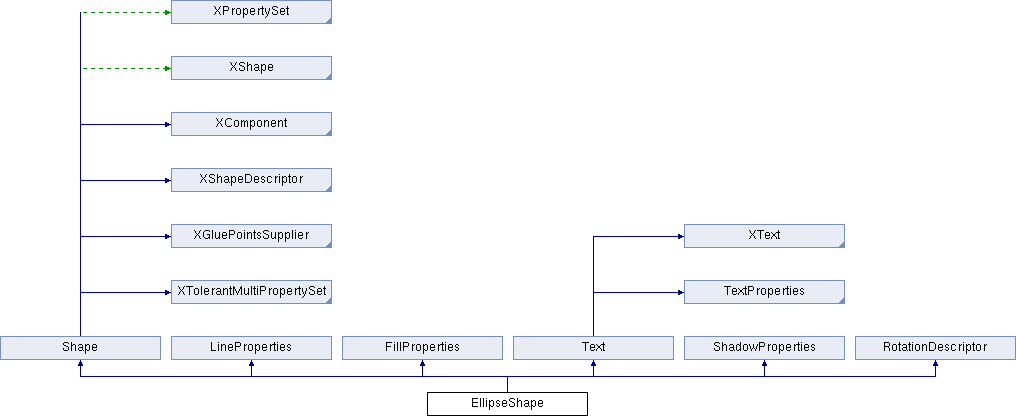
Fig. 110 :The EllipseShape Inheritance Diagram in the LibreOffice Online Documentation.
Clicking on the FillProperties rectangle jumps to its documentation, which lists a FillColor property (see Fig. 111).

Fig. 111 :Relevant Properties in the FillProperties Class.
Both the FillColor and FillStyle properties should be set, but the default value for FillStyle is already FillStyle.SOLID, which is what’s needed.
13.4 A Rectangle with a Variety of Fills
The rectangle example in Draw Gradient Examples comes in seven different colors show in Fig. 112.
# in DrawPicture._draw_Shapes()
# rectangle with different fills; uses (x, y) width, height
rect1 = curr_slide.draw_rectangle(x=70, y=100, width=75, height=25)
rect1.component.FillColor = CommonColor.LIME
# in DrawGradient Class()
def _gradient_fill(self, curr_slide: DrawPage[DrawDoc]) -> None:
    # rect1.component is com.sun.star.drawing.RectangleShape service which
    # also implements com.sun.star.drawing.FillProperties service.
    rect1 = curr_slide.draw_rectangle(
        x=self._x,
        y=self._y,
        width=self._width,
        height=self._height,
    )
    rect1.component.FillColor = self._start_color
    # other properties can be set
    # rect1.component.FillTransparence = 55
See also
In both Draw Picture and Draw Gradient Examples the code for creating a Rectangle is basically the same.
Draw Gradient Examples demonstrates that rect1 is also a FillProperties service
and other properties can be set.

Fig. 112 :Seven Ways of Filling a Rectangle.
13.4.1 Gradient Color
gradient color and gradient color Custom props are actually the same except gradient color Custom props
set properties after the gradient is created.
# in DrawGradient Class()
# creates color gradient and color Custom props gradient
def _gradient_name(self, curr_slide: DrawPage[DrawDoc], set_props: bool) -> None:
    # rect1.component is com.sun.star.drawing.RectangleShape service which
    # also implements com.sun.star.drawing.FillProperties service

    rect1 = curr_slide.draw_rectangle(
        x=self._x,
        y=self._y,
        width=self._width,
        height=self._height,
    )
    grad = rect1.set_gradient_color(name=self._name_gradient)
    if set_props:
        grad.Angle = self._angle * 10  # in 1/10 degree units
        grad.StartColor = self._start_color
        grad.EndColor = self._end_color
        rect1.set_gradient_properties(grad=grad)
The hardest part of using this function is determining what name value to pass to the FillGradientName property for FillProperties (e.g. “Neon Light”).
For this reason OooDev has a DrawingGradientKind Enum class that can be passed to Draw.set_gradient_color()
for easy lookup of gradient name. Optionally Draw.set_gradient_color() can be passed a string name instead of DrawingGradientKind.
To see the gradient name fire up Office’s Draw application, and check out the gradient names listed in the toolbar. Fig. 113 shows what happens when the user selects a shape and chooses the “Gradient” menu item from the combo box.

Fig. 113 :The Gradient Names in LibreOffice.
Calling _gradient_name() with set_props=True will result in creating a gradient similar to gradient color Custom props of Fig. 112.
The actual gradient created will depend on the Properties set for DrawGradient class instance.
13.4.2 Gradient Common Color
The fourth example in Fig. 112 shows what happens when you define your own gradient and angle of change. In DrawGradient class, the call is:
# in DrawGradient Class()
# creates gradient CommonColor
def _gradient(self, curr_slide: DrawPage[DrawDoc]) -> None:
    rect1 = curr_slide.draw_rectangle(
        x=self._x,
        y=self._y,
        width=self._width,
        height=self._height,
    )
    rect1.set_gradient_color(
        start_color=self._start_color,
        end_color=self._end_color,
        angle=Angle(self._angle),
    )
Draw.set_gradient_color() has several overloads and calls _set_gradient_color_colors() internally when setting x, y, width and height parameters:
# from the Draw class (simplified)
# called by set_gradient_color() overload method
@classmethod
def _set_gradient_color_colors(
    cls, shape: XShape, start_color: Color, end_color: Color, angle: Angle
) -> Gradient:

    grad = Gradient()
    grad.Style = GradientStyle.LINEAR
    grad.StartColor = start_color
    grad.EndColor = end_color

    grad.Angle = angle.Value * 10  # in 1/10 degree units
    grad.Border = 0
    grad.XOffset = 0
    grad.YOffset = 0
    grad.StartIntensity = 100
    grad.EndIntensity = 100
    grad.StepCount = 10

    cls.set_gradient_properties(shape, grad)

    return Props.get(shape, "FillGradient")
Draw.set_gradient_properties() sets the properties FillStyle and FillGradient.
The latter requires a Gradient object, which is documented in the FillProperties class, as shown in Fig. 114.

Fig. 114 :The FillGradient Property in the FillProperties Class.
Clicking on the com::sun:star:awt::Gradient name in Figure 10 loads its Gradient Struct Reference documentation,
which lists ten fields that need to be set.
The colors passed to Draw.set_gradient_color() are Color type which is a alias of int.
It is perfectly fine to pass integer values as Draw.set_gradient_color() start_color and end_color
Color constants can be found in color.CommonColor class.
Example of setting color.
from ooodev.office.draw import Draw
from ooodev.utils.color import CommonColor

# other code ...
Draw.set_gradient_color(shape=shape, start_color=CommonColor.RED, end_color=CommonColor.GREEN)
13.4.3 Hatching
The fifth fill in Fig. 112 employs hatching. In DrawGradient class, the call is:
# in DrawGradient Class()
def _gradient_hatching(self, curr_slide: DrawPage[DrawDoc]) -> None:
    rect1 = curr_slide.draw_rectangle(
        x=self._x,
        y=self._y,
        width=self._width,
        height=self._height,
    )
    rect1.set_hatch_color(name=self._hatch_gradient)
_gradient_hatching() Calls rect1.set_hatch_color() which invokes Draw.set_hatch_color().
# in Draw class (simplified)
@staticmethod
def set_hatch_color(shape: XShape, name: DrawingHatchingKind | str) -> None:

    props = Lo.qi(XPropertySet, shape, True)
    props.setPropertyValue("FillStyle", FillStyle.HATCH)
    props.setPropertyValue("FillHatchName", str(name))
See also
This function is much the same as Draw.set_gradient_properties() except that it utilizes FillHatchName rather
than FillGradientName, and the fill style is set to FillStyle.HATCH.
Suitable hatching names can be found by looking at the relevant list in Draw.
Fig. 115 shows the Hatching items.
The hardest part of using this function is determining what name value to pass to the FillHatchName property for FillProperties (e.g. “Green 30 Degrees”).
For this reason OooDev has a DrawingHatchingKind Enum class that can be passed to Draw.set_hatch_color()
for easy lookup of gradient name. Optionally Draw.set_hatch_color() can be passed a string name instead of DrawingHatchingKind.
To see the Hatching names fire up Office’s Draw application, and check out the Hatching names listed in the toolbar. Fig. 115 shows what happens when the user selects a shape and chooses the “Hatching” menu item from the combo box.

Fig. 115 :The Hatching Names in LibreOffice.
13.4.4 Bitmap Color
The sixth rectangle fill in Fig. 112 utilizes a bitmap color:
# in DrawGradient Class()
def _gradient_bitmap(self, curr_slide: DrawPage[DrawDoc]) -> None:
    rect1 = curr_slide.draw_rectangle(
        x=self._x,
        y=self._y,
        width=self._width,
        height=self._height,
    )
    rect1.set_bitmap_color(name=self._bitmap_gradient)
_gradient_bitmap() Calls rect1.set_bitmap_color() which invokes Draw.set_bitmap_color().
# in Draw class (simplified)
@staticmethod
def set_bitmap_color(shape: XShape, name: DrawingBitmapKind | str) -> None:

    props = Lo.qi(XPropertySet, shape, True)
    props.setPropertyValue("FillStyle", FillStyle.BITMAP)
    props.setPropertyValue("FillBitmapName", str(name))
See also
This function is also similar to Draw.set_gradient_properties() except that it utilizes FillBitmapName rather
than FillGradientName, and the fill style is set to FillStyle.BITMAP.
Suitable Bitmap names can be found by looking at the relevant list in Draw.
Fig. 116 shows the Bitmap items.
The hardest part of using this function is determining what name value to pass to the FillBitmapName property for FillProperties (e.g. “Maple Leaves”).
For this reason OooDev has a DrawingBitmapKind Enum class that can be passed to Draw.set_bitmap_color()
for easy lookup of gradient name. Optionally Draw.set_bitmap_color() can be passed a string name instead of DrawingBitmapKind.
To see the Bitmap names fire up Office’s Draw application, and check out the Bitmap names listed in the toolbar. Fig. 116 shows what happens when the user selects a shape and chooses the “Bitmap” menu item from the combo box.

Fig. 116 :The Bitmap Names in LibreOffice.
13.4.5 Bitmap File Color
The final fill in Fig. 112 loads a bitmap from crazy_blue.jpg:
# in DrawGradient Class()
# in this case self._gradient_fnm is crazy_blue.jpg
def _gradient_bitmap_file(self, curr_slide: DrawPage[DrawDoc]) -> None:
    rect1 = curr_slide.draw_rectangle(
        x=self._x,
        y=self._y,
        width=self._width,
        height=self._height,
    )
    rect1.set_bitmap_file_color(fnm=self._gradient_fnm)
_gradient_bitmap_file() Calls rect1.set_bitmap_file_color() which invokes Draw.set_bitmap_file_color().
# in Draw class (simplified)
@staticmethod
def set_bitmap_file_color(shape: XShape, fnm: PathOrStr) -> None:

    props = Lo.qi(XPropertySet, shape, True)
    props.setPropertyValue("FillStyle", FillStyle.BITMAP)
    props.setPropertyValue("FillBitmapURL", FileIO.fnm_to_url(fnm))
See also
The FillBitmapURL property requires a URL, so the filename is converted by FileIO.fnm_to_url().
13.5 Text
The “Hello LibreOffice” text shape in Fig. 105 is created by calling `` curr_slide.draw_text()`` which invokes Draw.draw_text():
text1 = curr_slide.draw_text(
    msg="Hello LibreOffice",
    x=120,
    y=120,
    width=60,
    height=30,
    font_size=24,
)
text1.component.Name = "text1"
The first four numerical parameters define the shape’s bounding rectangle in terms of its top-left coordinate, width, and height.
The fifth, optional number specifies a font size (in this case, 24pt).
Draw.draw_text() calls Draw.add_shape() with DrawingShapeKind.TEXT_SHAPE:
# in the draw class (simplified)
@classmethod
def draw_text(
    cls,
    slide: XDrawPage,
    msg: str,
    x: int | UnitT,
    y: int | UnitT,
    width: int | UnitT,
    height: int | UnitT,
    font_size: float | UnitT = 0,
) -> XShape:

    shape = cls.add_shape(
        slide=slide,
        shape_type=DrawingShapeKind.TEXT_SHAPE,
        x=x,
        y=y,
        width=width,
        height=height
    )
    cls.add_text(shape=shape, msg=msg, font_size=font_size)
    return shape
add_shape() adds the message to the shape, and sets its font size:
# in the draw class (simplified)
@classmethod
def add_shape(
    cls,
    slide: XDrawPage,
    shape_type: DrawingShapeKind | str,
    x: int | UnitT,
    y: int | UnitT,
    width: int | UnitT,
    height: int | UnitT,
) -> XShape:

    cls.warns_position(slide=slide, x=x, y=y)
    shape = cls.make_shape(shape_type=shape_type, x=x, y=y, width=width, height=height)
    slide.add(shape)
    return shape
See also
The shape is converted into an XText reference, and the text range selected with a cursor.
The CharHeight property comes from the CharacterProperties service, which is inherited by the Text service (as shown in Fig. 97).
Some Help with Text Properties
The text-related properties for a shape can be accessed with Draw.get_text_properties():
# in the draw class (simplified)
@staticmethod
def get_text_properties(shape: XShape) -> XPropertySet:
    xtxt = Lo.qi(XText, shape, True)
    cursor = xtxt.createTextCursor()
    cursor.gotoStart(False)
    cursor.gotoEnd(True)
    xrng = Lo.qi(XTextRange, cursor, True)
    return Lo.qi(XPropertySet, xrng, True)
See also
_draw_shapes() in draw_picture.py calls Draw.get_text_properties() on the text1 TextShape, and prints all its properties:
# in _draw_shapes() in draw_picture.py
text1 = curr_slide.draw_text(
    msg="Hello LibreOffice",
    x=120,
    y=120,
    width=60,
    height=30,
    font_size=24,
)
text1.component.Name = "text1"
Props.show_props(
    "TextShape's Text Properties",
    Draw.get_text_properties(text1.component)
)
The output is long, but includes the line:
CharHeight = 24.0
which indicates that the font size was correctly changed by the earlier call to Draw.draw_text().
13.6 Using a Shape Name
Immediately after the call to Draw.draw_text(), the shape’s name is set:
# in _draw_shapes() in draw_picture.py
text1.component.Name = "text1"
The Name property, which is defined in the Shape class, is a useful way of referring to a shape.
The show() function of draw_picture.py passes a name to Draw.find_shape_by_name():
# in show() in draw_picture.py
s = curr_slide.find_shape_by_name("text1")
Draw.report_pos_size(s.component)
curr_slide.find_shape_by_name() invokes Draw.find_shape_by_name():
# in the draw class (simplified)
@classmethod
def find_shape_by_name(cls, slide: XDrawPage, shape_name: str) -> XShape:
    shapes = cls.get_shapes(slide)
        sn = shape_name.casefold()
    if not shapes:
        raise ShapeMissingError("No shapes were found in the draw page")

    for shape in shapes:
        nm = str(Props.get(shape, "Name")).casefold()
        if nm == sn:
            return shape
    raise mEx.ShapeMissingError(f'No shape named "{shape_name}"')
See also
Draw.get_shapes() builds a list of shapes by iterating through the XDrawPage object as an indexed container of shapes:
In this case Draw.get_shapes() call the internal Draw method _get_shapes_slide().
# in the draw class (simplified)
@classmethod
def _get_shapes_slide(cls, slide: XDrawPage) -> List[XShape]:
    if slide.getCount() == 0:
        return []

    shapes: List[XShape] = []
    for i in range(slide.getCount()):
        shapes.append(mLo.Lo.qi(XShape, slide.getByIndex(i), True))
    return shapes
See also
Draw.report_pos_size() prints some brief information about a shape, including its name, shape type, position, and size:
# in the draw class
@classmethod
def report_pos_size(cls, shape: XShape) -> None:
    if shape is None:
        print("The shape is null")
        return
    print(f'Shape Name: {Props.get(shape, "Name")}')
    print(f"  Type: {shape.getShapeType()}")
    cls.print_point(shape.getPosition())
    cls.print_size(shape.getSize())
XShape.getShapeType() returns the class name of the shape as a string (in this case, TextShape).
13.7 A Transparent Circle and a Polar Line
The last two shapes created by draw_picture.py _draw_shapes() are a gray transparent circle and a polar line.
# in _draw_shapes() in draw_picture.py
# gray transparent circle; uses (x,y), radius
circle2 = curr_slide.draw_circle(x=40, y=150, radius=20)
circle2.component.FillColor = CommonColor.GRAY
circle2.set_transparency(level=Intensity(25))

# thick line; uses (x,y), angle clockwise from x-axis, length
line2 = curr_slide.draw_polar_line(x=60, y=200, degrees=45, distance=100)
line2.component.LineWidth = 300
A polar line is one defined using polar coordinates, which specifies the coordinate of one end of the line, and the angle and length of the line from that point.
Draw.draw_circle() uses an EllipseShape, and Draw.draw_polar_line() converts the polar values into two coordinates so Draw.draw_line() can be called.
13.8 A Math formula as an OLE Shape
Draw/Impress documents can include OLE objects through OLE2Shape, which allows a shape to link to an external document.
Probably the most popular kind of OLE shape is the chart, we will have a detailed discussion of that topic when we get to Part 5, although there is a code snippet below.
The best way of finding out what OLE objects are available is to go to Draw’s (or Impress’) Insert menu, Object, “OLE Object” dialog. It lists Office spreadsheet, chart, drawing, presentation, and formula documents, and a range of Microsoft and PDF types (when you click on “Further objects”).
The Draw Picture OLE example displays a mathematical formula, as in Fig. 117.

Fig. 117 :A Math Formula in a Draw Document.
draw_picture.py renders the formula by calling Draw.draw_formula(), which hides the tricky aspects of instantiating the OLE shape:
# in show() in draw_picture.py
s = curr_slide.draw_formula(
    formula="func e^{i %pi} + 1 = 0",
    x=70,
    y=20,
    width=75,
    height=40,
)
The formula argument is a formula string, written using Office’s Math notation. For an overview, see the “Commands Reference” appendix of the “Math Guide”, available from https://libreoffice.org/get-help/documentation.
curr_slide.draw_formula() invokes Draw.draw_formula(), it is coded as:
# in Draw class (simplified)
@classmethod
def draw_formula(
    cls,
    slide: XDrawPage,
    formula: str,
    x: int | UnitT,
    y: int | UnitT,
    width: int | UnitT,
    height: int | UnitT
) -> XShape:

    x = cls._get_unit_mm_int(x)
    y = cls._get_unit_mm_int(y)
    width = cls._get_unit_mm_int(width)
    height = cls._get_unit_mm_int(height)

    shape = cls.add_shape(
        slide=slide, shape_type=DrawingShapeKind.OLE2_SHAPE, x=x, y=y, width=width, height=height
    )
    cls.set_shape_props(shape, CLSID=str(Lo.CLSID.MATH))  # a formula

    model = mLo.Lo.qi(XModel, Props.get(shape, "Model"), True)
    # Info.show_services(obj_name="OLE2Shape Model", obj=model)
    Props.set(model, Formula=formula)

    # for some reason setting model Formula here cause the shape size to be blown out.
    # resetting size and position corrects the issue.
    cls.set_size(shape, Size(width, height))
    cls.set_position(shape, Point(x, y))
    return shape
See also
OLE2Shape uses a CLSID property to hold the class ID of the OLE object.
Setting this property affects the shape’s model (data format), which is stored in the Model property.
draw_formula() casts this property to XModel and, since the model represents formula data,
it has a Formula property where the formula string is stored.
Creating Other Kinds of OLE Shape
The use of a Formula property in Draw.draw_formula() only works for an OLE shape representing a formula. How are other kinds of data stored?
The first step is to set the OLE shape’s class ID to the correct value, which will affect its Model property.
Lo.CLSID is an enum containing some of the class ID’s.
Note its use in the previous code example, cls.set_shape_props(shape, CLSID=str(Lo.CLSID.MATH)).
Creating an OLE2Shape for a chart begins like so:
shape = cls.add_shape(
        slide=slide, shape_type=DrawingShapeKind.OLE2_SHAPE, x=x, y=y, width=width, height=height
    )
cls.set_shape_props(shape, CLSID=str(Lo.CLSID.CHART_CLSID))
model = Lo.qi(XModel, Props.get(shape, "Model"))
Online information on how to use XModel to store a chart, a graphic, or something else, is pretty sparse.
A good way is to list the services that support the XModel reference. This is done by calling Info.show_services():
Info.show_services("OLE2Shape Model", model)
For the version of model in draw_formula(), it reports:
OLE2Shape Model Supported Services (2)
  "com.sun.star.document.OfficeDocument"
  "com.sun.star.formula.FormulaProperties"
This gives a strong hint to look inside the FormulaProperties service, to find a property for storing the formula string.
A look at the documentation reveals a Formula property, which is used in draw_formula().
When the model refers to chart data, the same call to Info.show_services() prints:
OLE2Shape Model Supported Services (3)
  "com.sun.star.chart.ChartDocument"
  "com.sun.star.chart2.ChartDocument"
  "com.sun.star.document.OfficeDocument"
The com.sun.star.chart2 package is the newer way of manipulating charts, which suggests that the XModel interfaces should be converted to an interface of com.sun.star.chart2.ChartDocument.
The most useful is XChartDocument, which is obtained via: chart_doc = Lo.qi(XChartDocument, model) XChartDocument supports a rich set of chart manipulation methods.
We’ll return to charts in Part 5.
13.9 Polygons
The main() function of anim_bicycle.py calls Draw.draw_polygon() twice to create regular polygons for a square and pentagon:
# in animate() of anim_bicycle.py
square = slide.draw_polygon(x=125, y=125, sides=PolySides(4), radius=25)
# square.component is com.sun.star.drawing.PolyPolygonShape service.
square.component.FillColor = CommonColor.LIGHT_GREEN

pentagon = slide.draw_polygon(x=150, y=75, sides=PolySides(5))
# pentagon.component is com.sun.star.drawing.PolyPolygonShape service.
pentagon.component.FillColor = CommonColor.PURPLE
The polygons can be seen in Fig. 118.

Fig. 118 :Bicycle and Shapes.
# in Draw class (simplified)
@classmethod
def draw_polygon(
    cls,
    slide: XDrawPage,
    x: int | UnitT,
    y: int | UnitT,
    sides: PolySides | int,
    radius: int = POLY_RADIUS
) -> XShape:

    if radius is None:
        radius = Draw.POLY_RADIUS
    polygon = cls.add_shape(
        slide=slide,
        shape_type=DrawingShapeKind.POLY_POLYGON_SHAPE,
        x=0,
        y=0,
        width=0,
        height=0,
    )
    pts = cls.gen_polygon_points(x=x, y=y, radius=radius, sides=sides)
    # could be many polygons pts in this 2D array
    polys = (pts,)
    prop_set = mLo.Lo.qi(XPropertySet, polygon, raise_err=True)
    polyseq = uno.Any("[][]com.sun.star.awt.Point", polys)
    uno.invoke(prop_set, "setPropertyValue", ("PolyPolygon", polyseq))
    return polygon
See also
draw_polygon() creates a PolyPolygonShape shape which is designed to store multiple polygons.
This is why the polys data structure instantiated at the end of draw_polygon() is an array of points arrays,
since the shape’s PolyPolygon property can hold multiple point arrays. However, draw_polygon() only creates
a single points array by calling gen_polygon_points().
A points array defining the four points of a square could be:
from ooo.dyn.awt.point import Point

pts (
    Point(4_000, 1_200),
    Point(4_000, 2_000),
    Point(5_000, 2_000),
    Point(5_000, 1_200)
)
Note
The coordinates of each point use Office’s 1/100 mm units.
gen_polygon_points() generates a points array for a regular polygon based on the coordinate of the center of the polygon,
the distance from the center to each point (the shape’s radius), and the required number of sides:
# in Draw class (simplified)
@staticmethod
def gen_polygon_points(
    cls,
    x: int | UnitT,
    y: int | UnitT,
    radius: int | UnitT,
    sides: PolySides | int
) -> Tuple[Point, ...]:

    x = cls._get_mm100_obj_from_mm(x).value
    y = cls._get_mm100_obj_from_mm(y).value
    radius = cls._get_mm100_obj_from_mm(radius).value
    sides = PolySides(int(sides))
    pts: List[Point] = []
    angle_step = math.pi / sides.value
    for i in range(sides.value):
        pt = Point(
            round((x + radius * math.cos(i * 2 * angle_step))),
            round((y + radius * math.sin(i * 2 * angle_step))),
        )
        pts.append(pt)
    return tuple(pts)
See also
13.10 Multi-line Shapes
A PolyLineShape can hold multiple line paths, where a path is a sequence of connected lines.
Draw.draw_lines() only creates a single line path, based on being passed arrays of x- and y- axis coordinates.
For example, the following code in anim_bicycle.py creates the crossed lines at the top-left of Fig. 118:
# in animate() of anim_bicycle.py

xs = (10, 30, 10, 30)
ys = (10, 100, 100, 10)
slide.draw_lines(xs=xs, ys=ys)
`` slide.draw_lines()`` invokes Draw.draw_lines() which is coded as:
# in Draw class (simplified)
@classmethod
def draw_lines(cls, slide: XDrawPage, xs: Sequence[int], ys: Sequence[int]) -> XShape:

    num_points = len(xs)
    if num_points != len(ys):
        raise IndexError("xs and ys must be the same length")

    pts: List[Point] = []
    for x, y in zip(xs, ys):
        # in 1/100 mm units
        pts.append(Point(x * 100, y * 100))

    # an array of Point arrays, one Point array for each line path
    line_paths = (tuple(pts),)

    # for a shape formed by from multiple connected lines
    poly_line = cls.add_shape(
        slide=slide, shape_type=DrawingShapeKind.POLY_LINE_SHAPE, x=0, y=0, width=0, height=0
    )
    prop_set = mLo.Lo.qi(XPropertySet, poly_line, raise_err=True)
    seq = uno.Any("[][]com.sun.star.awt.Point", line_paths)
    uno.invoke(prop_set, "setPropertyValue", ("PolyPolygon", seq))
    return poly_line
See also
draw_lines() creates an tuple of Point tuples which is stored in the PolyLineShape property called PolyPolygon.
However, draw_lines() only adds a single points tuple to the line_paths data structure since only one line path is being created.
13.11 Partial Ellipses
EllipseShape contains a CircleKind property that determines whether the entire ellipse should be drawn, or only a portion of it.
The properties CircleStartAngle and CircleEndAngle define the angles where the solid part of the ellipse starts and finishes.
Zero degrees is the positive x-axis, and the angle increase in 1/100 degrees units counter-clockwise around the center of the ellipse.
anim_bicycle.py contains the following example:
# in animate() of anim_bicycle.py
pie = slide.draw_ellipse(
    x=30, y=slide_size.Width - 100, width=40, height=20
)
pie.set_property(
    FillColor=CommonColor.LIGHT_SKY_BLUE,
    CircleStartAngle=9_000,  #   90 degrees ccw
    CircleEndAngle=36_000,  #    360 degrees ccw
    CircleKind=CircleKind.SECTION,
)
This creates the blue partial ellipse shown at the bottom left of Fig. 118.
Fig. 119 shows the different results when CircleKind is set to CircleKind.SECTION, CircleKind.CUT, and CircleKind.ARC.

Fig. 119 :Different Types of Partial Ellipse