Chapter 21. Extracting Data
This chapter is about extracting data from a spreadsheet. Two types of extraction are described: methods which are supplied with a predetermined cell range in order to obtain data from cells, rows, columns, and 2D regions. The other type of extraction uses cell ranges generated at run time based on content queries applied to the entire used area of the sheet. This approach requires the use of sheet cursors.
All the example code comes from Extract Nums example, which examines the small_totals.ods spreadsheet shown in Fig. 179.
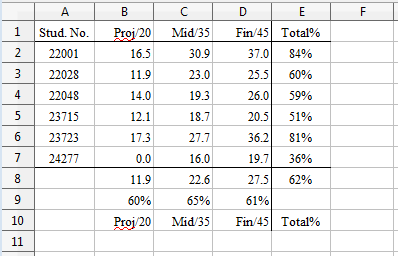
Fig. 179 :The small_totals.ods Spreadsheet.
Numerical data is stored in the cell range A2:D7 and the rest of the values are calculated using formulae.
extract_nums.py starts by accessing cells and cell ranges by name:
# from extract_nums.py
from __future__ import annotations
from typing import cast
import uno
from com.sun.star.sheet import XCellRangesQuery
from ooo.dyn.sheet.cell_flags import CellFlags

from ooodev.dialog.msgbox import (
    MsgBox,
    MessageBoxType,
    MessageBoxButtonsEnum,
    MessageBoxResultsEnum,
)
from ooodev.calc import Calc
from ooodev.calc import CalcDoc
from ooodev.formatters.formatter_table import FormatterTable, FormatTableItem
from ooodev.utils.file_io import FileIO
from ooodev.loader.lo import Lo
from ooodev.utils.type_var import PathOrStr, Row, Column


class ExtractNums:
    def __init__(self, fnm: PathOrStr) -> None:
        _ = FileIO.is_exist_file(fnm, True)
        self._fnm = FileIO.get_absolute_path(fnm)

    def main(self) -> None:
        loader = Lo.load_office(Lo.ConnectSocket())

        try:
            doc = CalcDoc(Calc.open_doc(fnm=self._fnm, loader=loader))

            doc.set_visible()

            sheet = doc.get_active_sheet()

            # basic data extraction
            # this code assumes the input file is "small totals.ods"
            print()
            print(f'A1 string: {sheet.get_val(cell_name="A1")}')  # string

            cell_name = "A2"
            cell = sheet.get_cell(cell_name=cell_name)
            print(f"{cell_name} type: {cell.get_type_string()}")
            print(f"{cell_name} value: {sheet.get_num(cell_name=cell_name)}")  # float

            cell_name = "E2"
            cell = sheet.get_cell(cell_name=cell_name)
            print(f"{cell_name} type: {cell.get_type_string()}")
            print(f"{cell_name} value: {cell.get_val()}")  # formula string

            rng = sheet.get_range(range_name="A1:E10")
            data = rng.get_array()
            # apply formatting entire table except for first and last rows.
            start_idx = Calc.get_row_used_first_index(sheet.component)
            end_idx = Calc.get_row_used_last_index(sheet.component)
            # format as float with two decimal places.
            fl = FormatterTable(format=(".2f", ">9"), idxs=(start_idx, end_idx))

            # add a custom row item formatter for first and last row only and pad items 9 spaces.
            fl.row_formats.append(
                FormatTableItem(format=">9", idxs_inc=(start_idx, end_idx))
            )

            # add a custom column formatter that formats the first column as integer values and move center in the column
            fl.col_formats.append(
                FormatTableItem(
                    format=(".0f", "^9"),
                    idxs_inc=(start_idx,),
                    row_idxs_exc=(start_idx, end_idx),
                )
            )

            # add a custom column formatter that formats the last column as percent
            fl.col_formats.append(
                FormatTableItem(
                    format=(".0%", ">9"),
                    idxs_inc=(4,),
                    row_idxs_exc=(start_idx, end_idx),
                )
            )
            Calc.print_array(data, fl)

            ids = sheet.get_float_array(range_name="A2:A7")
            fl = FormatterTable(format=(".1f", ">9"))
            Calc.print_array(ids, fl)

            projects = Calc.convert_to_floats(
                cast(Column, sheet.get_col(range_name="B2:B7"))
            )
            print("Project scores")
            for proj in projects:
                print(f"  {proj:.2f}")

            stud = Calc.convert_to_floats(cast(Row, sheet.get_row(range_name="A4:E4")))
            print()
            print("Student scores")
            for v in stud:
                print(f"  {v:.2f}")

            # create a cell range that spans the used area of the sheet
            used_cell_rng = sheet.find_used_range()
            print()
            print(f"The used area is: {used_cell_rng.get_range_str()}")

            # find cell ranges that cover all the specified data types
            cr_qry = used_cell_rng.qi(XCellRangesQuery, True)
            cell_ranges = cr_qry.queryContentCells(CellFlags.VALUE)
            # (CellFlags.VALUE | CellFlags.FORMULA)
            # (CellFlags.STRING)

            # process each of the cell ranges
            # -- extract each range as a 2D array of floats
            if cell_ranges is None:
                print("No cell ranges found")
            else:
                print(f"Found cell ranges: {cell_ranges.getRangeAddressesAsString()}")
                print()
                addresses = cell_ranges.getRangeAddresses()
                print(f"Cell Ranges: ({len(addresses)}):")
                fl = FormatterTable(format=(".2f", "<7"))
                # format the first col as integers
                fl.col_formats.append(
                    FormatTableItem(format=(".0f", "<7"), idxs_inc=(start_idx,))
                )
                for addr in addresses:
                    Calc.print_address(addr)
                    vals = sheet.get_float_array(range_name=Calc.get_range_str(addr))
                    print("WITH FORMATTING")
                    Calc.print_array(vals, fl)
                    # print("WITHOUT FORMATTING")
                    # Calc.print_array(vals)

            msg_result = MsgBox.msgbox(
                "Do you wish to close document?",
                "All done",
                boxtype=MessageBoxType.QUERYBOX,
                buttons=MessageBoxButtonsEnum.BUTTONS_YES_NO,
            )
            if msg_result == MessageBoxResultsEnum.YES:
                doc.close_doc()
                Lo.close_office()
            else:
                print("Keeping document open")

        except Exception:
            Lo.close_office()
            raise
Output:
A1 string: Stud. No.
A2 type: VALUE
A2 value: 22001.0
E2 type: FORMULA
E2 value: =SUM(B2:D2)/100
Row x Column size: 10 x 5
Stud. No.   Proj/20    Mid/35    Fin/45    Total%
  22001       16.46     30.92     37.01       84%
  22028       11.88     23.04     25.46       60%
  22048       13.96     19.25     25.99       59%
  23715       12.08     18.67     20.48       51%
  23723       17.29     27.71     36.23       81%
  24277        0.00     16.04     19.69       36%
              11.94     22.60     27.48       62%
               0.60      0.65      0.61
            Proj/20    Mid/35    Fin/45    Total%

Row x Column size: 6 x 1
  22001.0
  22028.0
  22048.0
  23715.0
  23723.0
  24277.0

Project scores
  16.46
  11.88
  13.96
  12.08
  17.29
  0.00

Student scores
  22048.00
  13.96
  19.25
  25.99
  0.59

The used area is: A1:E10
Found cell ranges: Marks.A2:D7

Cell Ranges: (1):
Range: Sheet1.A2:D7
WITH FORMATTING
Row x Column size: 6 x 4
22001   16.46   30.92   37.01
22028   11.88   23.04   25.46
22048   13.96   19.25   25.99
23715   12.08   18.67   20.48
23723   17.29   27.71   36.23
24277   0.00    16.04   19.69

WITHOUT FORMATTING
Row x Column size: 6 x 4
22001.0  16.4583333333333  30.9166666666667  37.0125
22028.0  11.875  23.0416666666667  25.4625
22048.0  13.9583333333333  19.25  25.9875
23715.0  12.0833333333333  18.6666666666667  20.475
23723.0  17.2916666666667  27.7083333333333  36.225
24277.0  0.0  16.0416666666667  19.6875
21.1 Getting a Cell Value
There are four versions of Calc.get_val() which access a value by cell name or position:
# in Calc class (overload methods, simplified)
@classmethod
def get_val(cls, sheet: XSpreadsheet, addr: CellAddress) -> object | None:
    if addr is None:
        return None
    return cls.get_val(sheet=sheet, col=addr.Column, row=addr.Row)

@classmethod
def get_val(cls, sheet: XSpreadsheet, cell_name: str) -> object | None:
    pos = cls.get_cell_position(cell_name)
    return cls.get_val(sheet=sheet, col=pos.X, row=pos.Y)

@classmethod
def get_val(cls, sheet: XSpreadsheet, col: int, row: int) -> object | None:
    xcell = cls.get_cell(sheet=sheet, col=col, row=row)
    return cls.get_val(cell=xcell)

@classmethod
def get_val(cls, cell: XCell) -> object | None:
    t = cell.getType()
    if t == CellContentType.EMPTY:
        return None
    if t == CellContentType.VALUE:
        return cls.convert_to_float(cell.getValue())
    if t == CellContentType.TEXT or t == CellContentType.FORMULA:
        return cell.getFormula()
    Lo.print("Unknown cell type; returning None")
    return None
See also
The fourth get_val(cls, cell: XCell) utilizes XCell.getType() to decide how to extract the value.
A cell may contain four different data types: a number, text, a formula, or be empty.
When the data is numerical, the double value is accessed by calling XCell.getValue(), while for text or a formula XCell.getFormula() is employed.
get_val() returns these different types of data.
This return type may be inconvenient for a user, who might have to cast the result to something more specific, such as a float.
The support functions include Calc.get_num() which does this task.
There’s also Calc.get_type_string() which returns cell type information as a string:
# in Calc class
@classmethod
def get_type_string(cls, cell: XCell) -> str:
    t = cls.get_type_enum(cell=cell)
    return str(t)

@staticmethod
def get_type_enum(cell: XCell) -> Calc.CellTypeEnum:
    t = cell.getType()
    if t == CellContentType.EMPTY:
        return Calc.CellTypeEnum.EMPTY
    if t == CellContentType.VALUE:
        return Calc.CellTypeEnum.VALUE
    if t == CellContentType.TEXT:
        return Calc.CellTypeEnum.TEXT
    if t == CellContentType.FORMULA:
        return Calc.CellTypeEnum.FORMULA
    Lo.print("Unknown cell type")
    return Calc.CellTypeEnum.UNKNOWN
21.2 Getting the Data from a Cell Range
Calc.get_array() extracts the data from a cell range as a 2D tuple (TupleArray) of Objects. It utilizes XCellRangeData.getDataArray():
# in Calc class (overloads method, simplified)
@classmethod
def get_array(cls, sheet: XSpreadsheet, range_name: str) -> TupleArray:
    cell_range = cls.get_cell_range(sheet=sheet, range_name=range_name)
    cr_data = Lo.qi(XCellRangeData, cell_range, raise_err=True)
    return cr_data.getDataArray()
XCellRangeData.getDataArray() evaluates any formulae it encounters.
This can be seen in the output from:
# from extract_nums.py
rng = sheet.get_range(range_name="A1:E10")
data = rng.get_array()
The cell range includes several formulae (e.g. in E8 and E9), but the data array contains their numerical values.
If you don’t want formulae to be evaluated then you’ll need to implement your own version of get_array() which uses XCellRangeFormula.
Its getDataArray() method doesn’t process formulae.
The code would look something like:
cell_Range = get_cell_range(sheet, range_name) # XCellRange
cr_form  = Lo.qi(XCellRangeFormula, cell_Range) # XCellRangeFormula
return cr_form.getDataArray()
Calc.get_array() returns (TupleArray) a 2D Tuple of Objects.
Calc.get_float_array() can be employed to cast them to List of List that contains floats (FloatTable).
21.3 Getting Rows and Columns of Data
Calc.get_row() extracts a row of data by utilizing Calc.get_array() since the array is in row-major order:
# in Calc class
@classmethod
def get_row(cls, sheet: XSpreadsheet, range_name: str) -> List[Any]:
    vals = cls.get_array(sheet=sheet, range_name=range_name)
    return cls.extract_row(vals=vals, row_idx=0)

@staticmethod
def extract_row(vals: Table, row_idx: int) -> List[Any]:
    row_len = len(vals)
    if row_idx < 0 or row_idx > row_len - 1:
        raise IndexError("Row index out of range")

    return vals[row_idx]
Calc.get_row() defaults to extracting the first row in the 2d TupleArray returned by Calc.get_array(),
but it’s possible to obtain other rows by directly calling Calc.extract_row().
Extracting a column from a sheet is more tricky since Calc.extract_col() must navigate the row-ordered TupleArray returned by Calc.get_array().
The retrieved column is returned as a 1D List:
# in Calc class
@classmethod
def get_col(cls, sheet: XSpreadsheet, range_name: str) -> List[Any] | None:
    vals = cls.get_array(sheet=sheet, range_name=range_name)
    return cls.extract_col(vals=vals, col_idx=0)

@staticmethod
def extract_col(vals: Table, col_idx: int) -> List[Any] | None:
    row_len = len(vals)
    if row_len == 0:
        return None
    col_len = len(vals[0])
    if col_idx < 0 or col_idx > col_len - 1:
        Lo.print("Column index out of range")
        return None

    col_vals = []
    for row in vals:
        col_vals.append(row[col_idx])
    return col_vals
21.4 Obtaining Cell Ranges by Using Queries
A drawback of extracting data from a spreadsheet with get_val(), get_array(), get_row(),
and get_col() is that they require the programmer to supply cell names or ranges.
In other words, the location of the data must be known beforehand.
For example, the call:
ids = Calc.get_float_array(sheet, "A2:A7");
assumes that the data is located in the A2:A7 range.
A more flexible approach is offered by the SheetRangesQuery service, which can search for a cell range (or ranges) satisfying a content query. For example, it can return a sequence of cell ranges that cover all the numerical data in the sheet, or cell ranges for all the formulae.
The search area for these queries is usually the entire used part of a sheet, which are all the cells containing numbers, text, or formulae.
Obtaining this area involves sheet cursors, but the details are hidden inside Calc.find_used_range().
The following code fragment illustrates how Calc.find_used_range() and the SheetRangesQuery service can be used together :
# in extract_nums.py
# create a cell range that spans the used area of the sheet
used_cell_rng = sheet.find_used_range()
# ...

# find cell ranges that cover all the specified data types
cr_qry = used_cell_rng.qi(XCellRangesQuery, True)
cell_ranges = cr_qry.queryContentCells(CellFlags.VALUE)
sheet.find_used_range() invokes Calc.find_used_range().
The cell range returned by Calc.find_used_range() is converted to XCellRangesQuery, which contains the SheetRangesQuery methods.
XCellRangesQuery.queryContentCells() is passed the CellFlags.VALUE constant so that the search will returns ranges that cover all the numerical data.
The SheetRangesQuery service is inherited by SheetCell, SheetCellRange, and SheetCellRanges, as summarized in Fig. 180.
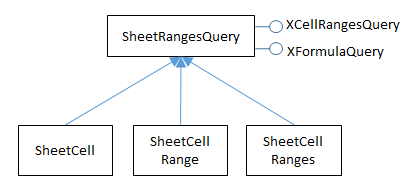
Fig. 180 :The SheetRangesQuery Services and Interfaces.
The XFormulaQuery interface is used to find cells that are used by a formula, or cells that utilize a formula’s result.
See CellFlags constants used in XCellRangesQuery.queryContentCells().
Extract Nums uses ooouno library to import CellFlags. ooouno library makes working with uno easier in many ways.
from ooo.dyn.sheet.cell_flags import CellFlags
The constants are Flags can be combined with bit operations, such as |.
For instance, the query:
# XSheetCellRanges
cell_ranges =  cr_query.queryContentCells((CellFlags.VALUE | CellFlags.FORMULA))
finds all the cell ranges that contain numbers or formulae.
The XSheetCellRanges object is most easily processed as an tuple of cell range addresses:
The following code prints out each range address and the numerical data in the range:
# in extract_nums.py
# ...
if cell_ranges is None:
    print("No cell ranges found")
else:
    print(f"Found cell ranges: {cell_ranges.getRangeAddressesAsString()}")
    print()
    addresses = cell_ranges.getRangeAddresses()
    print(f"Cell Ranges: ({len(addresses)}):")
    fl = FormatterTable(format=(".2f", "<7"))
    # format the first col as integers
    fl.col_formats.append(
        FormatTableItem(format=(".0f", "<7"), idxs_inc=(start_idx,))
    )
    for addr in addresses:
        Calc.print_address(addr)
        vals = sheet.get_float_array(range_name=Calc.get_range_str(addr))
        print("WITH FORMATTING")
        Calc.print_array(vals, fl)
        # print("WITHOUT FORMATTING")
        # Calc.print_array(vals)
# ...
For the small_totals.ods spreadsheet shown in Fig. 179, the output is:
Output:
Found cell ranges: Marks.A2:D7

Cell Ranges: (1):
Range: Sheet1.A2:D7
WITH FORMATTING
Row x Column size: 6 x 4
22001   16.46   30.92   37.01
22028   11.88   23.04   25.46
22048   13.96   19.25   25.99
23715   12.08   18.67   20.48
23723   17.29   27.71   36.23
24277   0.00    16.04   19.69
The query found the range A2:D7, which excludes the labels on the first row, and the formula down the E column and along rows 8 and 9 (see Fig. 179).
These formulae could be included by modifying the query:
cr_query.queryContentCells(CellFlags.VALUE | CellFlags.FORMULA)
# remove formatting on first column
# fl.col_formats.append(FormatTableItem(format=(".0f", "<7"), idxs_inc=(0,)))
Changed Output:
Found cell ranges: Marks.A2:A7,Marks.B2:D9,Marks.E2:E8

Cell Ranges: (3):
Range: Sheet1.A2:A7
WITH FORMATTING
Row x Column size: 6 x 1
22001.00
22028.00
22048.00
23715.00
23723.00
24277.00

Range: Sheet1.B2:D9
WITH FORMATTING
Row x Column size: 8 x 3
16.46   30.92   37.01
11.88   23.04   25.46
13.96   19.25   25.99
12.08   18.67   20.48
17.29   27.71   36.23
0.00    16.04   19.69
11.94   22.60   27.48
0.60    0.65    0.61

Range: Sheet1.E2:E8
WITH FORMATTING
Row x Column size: 7 x 1
0.84
0.60
0.59
0.51
0.81
0.36
0.62
The query returned three cell ranges.
You might think they would be the numerical region (as before) and two ranges covering the formulae down the E column and along rows 8 and 9.
However, the regions are those highlighted in Fig. 181.
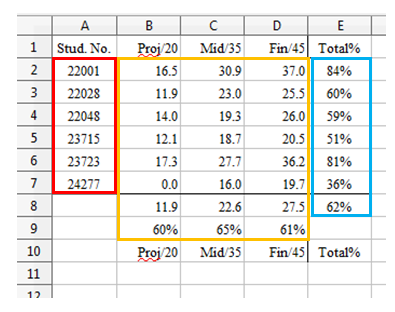
Fig. 181 :The Cell Ranges Returned by the Value+Formula Query.
The shape of these ranges suggests that they’re chosen to maximize column length. Also searching for two content types (i.e. numbers and formulae) means that a single cell range may contain both types of data.
21.5 Finding the Used Area with Sheet Cursors
The previous section relied on Calc.find_used_range() to retrieve the sheet’s used area; this section explains how that method is implemented using sheet cursors.
A sheet cursor is analogous to a text cursor but moves across cells in a spreadsheet. As the cursor is moved, its cell range can be expanded or collapsed in a variety of ways, which parallels the selection of text by a text cursor.
Calc.find_used_range() creates a cursor and then calls find_used_cursor() to expand its cell range over the used area:
# in Calc class
@classmethod
def find_used_range(cls, sheet: XSpreadsheet, cell_name: str = None) -> XCellRange:
    if cell_name is None:
        cursor = sheet.createCursor()
    else:
        xrange = cls._get_cell_range_rng_name(sheet=sheet, range_name=cell_name)
        cell_range = Lo.qi(XSheetCellRange, xrange)
        cursor = sheet.createCursorByRange(cell_range)
    return cls.find_used_cursor(cursor)

@staticmethod
def find_used_cursor(cursor: XSheetCellCursor) -> XCellRange:
    # find the used area
    ua_cursor = Lo.qi(XUsedAreaCursor, cursor, True)
    ua_cursor.gotoStartOfUsedArea(False)
    ua_cursor.gotoEndOfUsedArea(True)

    used_range = Lo.qi(XCellRange, ua_cursor, True)
    return used_range
Fig. 182 shows the services and interfaces related to sheet cursors.
Calc.find_used_range() employs the XSheetCellCursor interface.
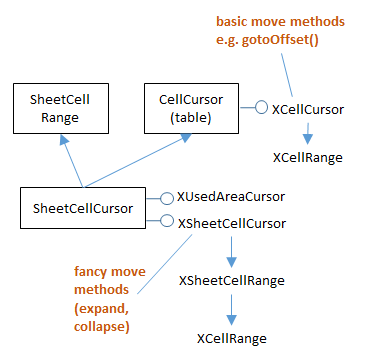
Fig. 182 :The SheetCellCursor Services and Interfaces.
An XSheetCellCursor cursor is assigned to a sheet by calling XSpreadsheet.createCursor() or XSpreadsheet.createCursorByRange().
Calc.find_used_range() needs the ability to find the sheet’s used area, which is obtained by converting XSheetCellCursor into XUsedAreaCursor (see Fig. 182):
# in Calc class
ua_cursor = Lo.qi(XUsedAreaCursor, cursor, True)
ua_cursor.gotoStartOfUsedArea(False)
ua_cursor.gotoEndOfUsedArea(True)
The goto methods move the cursor to the start and end of the used area, and by calling gotoEndOfUsedArea() with a True flag,
the cursor’s cell range is extended from the start of the used area to its end.
The cell range is retrieved by converting the cursor into a XCellRange:
used_range = Lo.qi(XCellRange, ua_cursor, True)
See also
21.6 Formatting table data for console
extract_nums.py makes several calls to Calc.print_array() that prints 2d (Table) sequence to console.
Without any formatting this can be difficult to read
OooDev has a way of aiding in formatting via the formatters module.
More specifically for Calc.print_array() it can be passed a formatter (Class FormatterTable).
In the following example you can see without any formatting the output is not very human readable.
# Without Formatting
>>> data = Calc.get_array(sheet=sheet, range_name="A1:E10")
>>> Calc.print_array(data)

Row x Column size: 10 x 5
Stud. No.  Proj/20  Mid/35  Fin/45  Total%
22001.0  16.4583333333333  30.9166666666667  37.0125  0.843875
22028.0  11.875  23.0416666666667  25.4625  0.603791666666667
22048.0  13.9583333333333  19.25  25.9875  0.591958333333333
23715.0  12.0833333333333  18.6666666666667  20.475  0.51225
23723.0  17.2916666666667  27.7083333333333  36.225  0.81225
24277.0  0.0  16.0416666666667  19.6875  0.357291666666667
  11.9444444444444  22.6041666666667  27.475  0.620236111111111
  0.597222222222222  0.645833333333334  0.610555555555556
  Proj/20  Mid/35  Fin/45  Total%
However, with formatting it becomes much easier to read data in console.
# With Formatting
>>> data = Calc.get_array(sheet=sheet, range_name="A1:E10")
>>> fl = FormatterTable(format=(".2f", ">9"), idxs=(0, 9))
>>> fl.custom_formats_row.append(FormatTableItem(format=">9", idxs_inc=(0, 9)))
>>> fl.col_formats.append(FormatTableItem(format=(".0f", "^9"), idxs_inc=(0,), row_idxs_exc=(0, 9)))
>>> fl.col_formats.append(FormatTableItem(format=(".0%", ">9"), idxs_inc=(4,), row_idxs_exc=(0, 9)))
>>> Calc.print_array(data, fl)

Row x Column size: 10 x 5
Stud. No.   Proj/20    Mid/35    Fin/45    Total%
  22001       16.46     30.92     37.01       84%
  22028       11.88     23.04     25.46       60%
  22048       13.96     19.25     25.99       59%
  23715       12.08     18.67     20.48       51%
  23723       17.29     27.71     36.23       81%
  24277        0.00     16.04     19.69       36%
              11.94     22.60     27.48       62%
               0.60      0.65      0.61
            Proj/20    Mid/35    Fin/45    Total%
Breakdown of this formatting example:
Create a new FormatterTable formatter class, format as float with two decimal places.
fl = FormatterTable(format=(".2f", ">9"), idxs=(0, 9))
format=(".2f", ">9")formats to be applied..2fFormats numbers as with two decimal places.>9Formats values to be be at least9characters long and be padded on the left if shorter.
idxs(0, 9)Do not apply to row with index of0or9
Add a custom row item formatter for first and last row only and pad items 9 spaces.
fl.row_formats.append(FormatTableItem(format=">9", idxs_inc=(0, 9)))
format=">9"Formats values to be be at least9characters long and be padded on the left if shorter.idxs_inc(0, 9)Apply only to rows with index of0and9
Add a custom column formatter that formats the first column as integer values and move center in the column.
fl.col_formats.append(FormatTableItem(format=(".0f", "^9"), idxs_inc=(0,), row_idxs_exc=(0, 9)))
format=(".0f", "^9"))formats to be applied..0fFormats numbers as with no decimal places, integer format.^9Formats values to be be at least9characters long and centered
idxs_inc(0,)Format Column with index of0row_idxs_exc=(0, 9)Do not format column0for row indexes of0and9
Add a custom column formatter that formats the last column as percent
fl.col_formats.append(FormatTableItem(format=(".0%", ">9"), idxs_inc=(4,), row_idxs_exc=(0, 9)))
format=(".0%", ">9"))formats to be applied..0%Formats numbers as percentage>9Formats values to be be at least9characters long and be padded on the left if shorter.
idxs_inc(4,)Format Column with index of4row_idxs_exc=(0, 9)Do not format column4for row indexes of0and9
Pass the formatter to Calc.print_array().
Calc.print_array(data, fl)