Chapter 23. Garlic Secrets
This chapter’s garlic_secrets.py example illustrates how data can be extracted from an existing spreadsheet (produceSales.xlsx) using general functions, sheet searching, and sheet range queries.
It also has more examples of cell styling, and demonstrates sheet freezing, view pane splitting, pane activation, and the insertion of new rows into a sheet.
The idea for this chapter, and the data, comes from the Excel example in “Automate the Boring Stuff with Python” by Al Sweigart, chapter 13. However, he utilized the Python library OpenPyXL to manipulate his file.
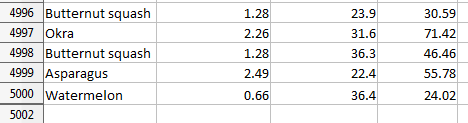
The beginning of the spreadsheet is shown in Fig. 188.

Fig. 188 :Part of the produceSales.xlsx Spreadsheet.
Each row holds information about the sale of fruit or vegetables.
The columns are the type of produce sold column A, the cost per pound of that produce B, the number of pounds sold C, and the total revenue from the sale D.
The TOTAL column is calculated using a formula which multiplies the cost per pound by the number of pounds sold, and rounds the result to the nearest cent.
For example, cell D2 contains =ROUND(B2*C2, 2).
Most of the main() function for garlic_secrets.py is shown below.
I’ll explain the commented out parts in later sections:
# garlic_secrets.py
def main(self) -> None:
    loader = Lo.load_office(Lo.ConnectSocket())

    doc = CalcDoc(Calc.open_doc(fnm=self._fnm, loader=loader))

    doc.set_visible()

    sheet = doc.get_sheet(0)
    sheet.goto_cell(cell_name="A1")

    # freeze one row of view
    # doc.freeze_rows(num_rows=1)

    # find total for the "Total" column
    total_range = sheet.get_col_range(idx=3)
    total = doc.compute_function(
        fn=GeneralFunction.SUM, cell_range=total_range.component
    )
    print(f"Total before change: {total:.2f}")
    print()

    self._increase_garlic_cost3(sheet)  # takes several seconds

    # recalculate total
    total = doc.compute_function(fn=GeneralFunction.SUM, cell_range=total_range)
    print(f"Total after change: {total:.2f}")
    print()

    # add a label at the bottom of the data, and hide it

    # split window into 2 view panes

    # access panes; make top pane show first row

    # display view properties

    # show view data

    # show sheet states

    # make top pane the active one in the first sheet

    # show revised sheet states

    # add a new first row, and label that as at the bottom

    # Save doc

    # ...
23.1 Freezing Rows
doc.freeze_rows() invokes Calc.freeze_rows() that specifies the number of rows that should be frozen on-screen as Office’s view of the spreadsheet changes (i.e. when the user scrolls downwards).
The function’s argument is the number of rows to freeze, not a row index, and the choice of which rows are frozen depends on which row is currently selected (active) in the application window when the function is called.
The earlier call to i.e. Calc.goto_cell() in main() means that A1 is the active cell in the spreadsheet,
and so row 1 is the active row (and A the active column).
For that reason, Calc.freeze_rows(doc=doc, num_rows=1) will freeze rows 1, 2, and 3 so they remain in view when the spreadsheet is scrolled up or down.
Calc.freeze_rows() and Calc.freeze_cols() are implemented using Calc.freeze():
# in Calc class
@classmethod
def freeze_rows(cls, doc: XSpreadsheetDocument, num_rows: int) -> None:
    cls.freeze(doc=doc, num_cols=0, num_rows=num_rows)

@classmethod
def freeze_cols(cls, doc: XSpreadsheetDocument, num_cols: int) -> None:
    cls.freeze(doc=doc, num_cols=num_cols, num_rows=0)

@classmethod
def freeze(cls, doc: XSpreadsheetDocument, num_cols: int, num_rows: int) -> None:
    ctrl = cls.get_controller(doc)
    if ctrl is None:
        return
    if num_cols < 0 or num_rows < 0:
        return
    xfreeze = Lo.qi(XViewFreezable, ctrl)
    xfreeze.freezeAtPosition(num_cols, num_rows)
Calc.freeze() accesses the SpreadsheetView service (see Fig. 189) via the document’s controller, and utilizes its XViewFreezable interface to call freezeAtPosition().

Fig. 189 :The SpreadsheetView Services and Interfaces.
23.2 General Functions
Office has a small set of functions (called GeneralFunction) which can be applied to cell ranges without the need for formula strings (i.e. a string starting with =).
The more important functions are shown in Table 7.
GeneralFunction Name |
Calculation Applied to the Cell Values |
|---|---|
SUM |
Sum the numerical values. |
COUNT |
Count all the values, including the non-numerical ones. |
COUNTNUMS |
Count only the numerical values. |
AVERAGE |
Average all the numerical values. |
MAX |
Find the maximum of all the numerical values. |
MIN |
Find the minimum of all the numerical values. |
PRODUCT |
Return the product of all the numerical values. |
STDEV |
Standard deviation is calculated based on a sample. |
GeneralFunction.SUM is used in main(), to sum the TOTALS column of the spreadsheet:
# in garlic_secrets.py
total_range = Calc.get_col_range(sheet=sheet, idx=3)
total = Calc.compute_function(fn=GeneralFunction.SUM, cell_range=total_range)
Cal.get_col_range() utilizes the XColumnRowRange interface to access the sheet as a series of columns.
The required column is extracted from the series via its index position:
# in Calc class
@staticmethod
def get_col_range(sheet: XSpreadsheet, idx: int) -> XCellRange:
    cr_range = Lo.qi(XColumnRowRange, sheet)
    if cr_range is None:
        raise MissingInterfaceError(XColumnRowRange)
    cols = cr_range.getColumns()
    con = Lo.qi(XIndexAccess, cols)
    if con is None:
        raise MissingInterfaceError(XIndexAccess)
    cell_range = Lo.qi(XCellRange, con.getByIndex(idx))
    if cell_range is None:
        raise MissingInterfaceError(
            XCellRange, f"Could not access range for column position: {idx}"
        )
    return cell_range
The sheet can also be treated as a series of rows by calling XColumnRowRange.getRows(), as in Calc.get_row_range():
# in Calc class
@staticmethod
def get_row_range(sheet: XSpreadsheet, idx: int) -> XCellRange:
    cr_range = Lo.qi(XColumnRowRange, sheet)
    if cr_range is None:
        raise MissingInterfaceError(XColumnRowRange)
    rows = cr_range.getRows()
    con = con = Lo.qi(XIndexAccess, rows)
    if con is None:
        raise MissingInterfaceError(XIndexAccess)
    cell_range = Lo.qi(XCellRange, con.getByIndex(idx))
    if cell_range is None:
        raise MissingInterfaceError(XCellRange, f"Could not access range for row position: {idx}")
    return cell_range
The column returned by Calc.get_col_range(sheet=sheet, idx=3) includes the cell containing the word TOTALS, but GeneralFunction.SUM only sums cells holding numerical data.
Calc.compute_function() obtains the XSheetOperation interface for the cell range, and calls XSheetOperation.computeFunction() to apply a GeneralFunction:
# in Calc class
@classmethod
def compute_function(cls, fn: GeneralFunction | str, cell_range: XCellRange) -> float:
    try:
        sheet_op = Lo.qi(XSheetOperation, cell_range, raise_err=True)
        func = GeneralFunction(fn)  # convert to enum value if str
        if not isinstance(fn, uno.Enum):
            Lo.print("Arg fn is invalid, returning 0.0")
            return 0.0
        return sheet_op.computeFunction(func)
    except Exception as e:
        Lo.print("Compute function failed. Returning 0.0")
        Lo.print(f"    {e}")
    return 0.0
23.3 Searching for the Cost of Garlic, and Increasing it
garlic_secrets.py increases the Code per Pound value for every garlic entry.
The source document uses $1.19 (i.e. see row 6 of Fig. 188).
Due to a worldwide garlic shortage, this must be increased by 5% to $1.2495.
_increase_garlic_cost() in garlic_secrets.py scans every used row in the sheet, examining the Produce cell to see if it contains the string Garlic.
When the string is found, the corresponding Cost per Pound entry on that row is changed.
When the scanning reaches an empty cell, the end of the data has been reached, and the function returns.
# in garlic_secrets.py
def _increase_garlic_cost3(self, sheet: CalcSheet) -> int:
        start_time = time.time()
        row_count = 0
        cell = sheet.get_cell(col=0, row=row_count)  # produce column
        red_font = Font(b=True, color=CommonColor.RED)

        used_rng = sheet.find_used_range_obj()
        # operations can be preformed on RangeObj instances
        rng_col1 = 1 - used_rng.get_col(0)  # omit the first row (header)
        data = sheet.get_array(range_obj=rng_col1)
        for row in data:
            row_count += 1
            if row[0] == "Garlic":
                cell = sheet.get_cell(col=0, row=row_count)
                _ = sheet.goto_cell(cell_obj=cell.cell_obj)
                # change cost/pound column
                cost_cell = sheet.get_cell(col=1, row=row_count)
                # make the change more visible by making the text bold and red
                cost_cell.set_val(1.05 * cost_cell.get_num(), [red_font])
        end_time = time.time()
        print(f"Time to iterate over array: {end_time - start_time:.2f} seconds")
- Note:
garlic_secrets.py has three versions of
_increase_garlic_cost(). The version used here is_increase_garlic_cost3()which is the fastest.. See the source code for more on this.
To help the user see that changes have been made to the sheet, the text of each updated Cost per Pound cell is made bold and red.
The cell properties being altered come from the CharacterProperties class.
The progression of the function is also highlighted by calling sheet.goto_cell() that invokes Calc.goto_cell() inside the loop.
This causes the spreadsheet to scroll down, to follow the changes.
Back in main() after the updates, the Totals column is summed once again, and the new value reported:
Total before change: 231353.27
Total after change: 231488.35

23.5 Adding the Label
_add_garlic_label() adds the large text string Top Secret Garlic Changes to the first cell in the supplied row.
The cell is made wider by merging a few cells together, made taller by adjusting the row height, and turned bright red.
# in garlic_secrets.py
def _add_garlic_label(self, sheet: CalcSheet, empty_row_num: int) -> None:
    """
    Add a large text string ("Top Secret Garlic Changes") to the first cell
    in the empty row. Make the cell bigger by merging a few cells, and taller
    The text is black and bold in a red cell, and is centered.
    """

    sheet.goto_cell(cell_obj=sheet.get_cell(col=0, row=empty_row_num).cell_obj)

    # Merge first few cells of the last row
    rng_obj = Calc.get_range_obj(
        col_start=0, row_start=empty_row_num, col_end=3, row_end=empty_row_num
    )

    # merge and center range
    sheet.merge_cells(range_obj=rng_obj, center=True)

    # make the row taller
    sheet.set_row_height(height=18, idx=empty_row_num)
    # get the cell from the range cell start
    font_red = Font(b=True, size=24, color=CommonColor.BLACK)
    bg_color = BgColor(CommonColor.RED)

    cell = sheet.get_cell(cell_obj=rng_obj.cell_start)
    cell.set_val(value="Top Secret Garlic Changes", styles=[font_red, bg_color])
Cell merging requires a cell range, which is obtained by calling the version of Calc.get_range_obj() that employs start and end cell positions in (column, row) order.
The range spans the first four cells of the empty row, making it wide enough for the large text.
The XMergeable interface is supported by the SheetCellRange service and uses merge() with a boolean argument to merge or unmerge a cell range.
Calc.merge_cells() makes use of XMergeable and SheetCellRange to merge and center the range into a single cell range.
Changing the cell height affects the entire row, not just the merged cells, and so Calc.set_row_height() manipulates a cell range representing the row:
# in Calc class (simplified)
@classmethod
def set_row_height(
    cls, sheet: XSpreadsheet, height: int, idx: int
    ) -> XCellRange:

    if height <= 0:
        Lo.print("Height must be greater then 0")
        return None
    cell_range = cls.get_row_range(sheet=sheet, idx=idx)
    # Info.show_services(obj_name="Cell range for a row", obj=cell_range)
    Props.set(cell_range, Height=(height * 100))
    return cell_range
See also
set_row_height() illustrates the difficulties of finding property documentation.
The first line obtains an XCellRange interface for the row, and the second line changes a property in the cell range’s service.
Pretend for a moment, that we don’t know the name of this height property (Height). How could we find it?
That depends on finding the cell range’s service. First turn to the online documentation for the XCellRange class, which includes the class diagram shown in Fig. 192.

Fig. 192 :Classes that Inherit XCellRange
This diagram combines the service and interface inheritance hierarchies.
Ignoring the interfaces that inherit XCellRange is easy because their names always begin with X.
The remaining names mean that XCellRange is implemented by almost every service in the Calc API: CellRange (twice), TableColumn, TableRow, and TextTable.
CellRange appears twice because the blue triangle in the bottom-right corner of the first CellRange box means that there’s more subclass hierarchy that’s not shown;
in this case, SheetCellRange, SheetCellCursor, and Spreadsheet.
The height property must be in one of these services, or one of their super-classes.
The correct choice is TableRow because the cell range is representing a spreadsheet row.
TableRow contains four properties, one of which is Height.
Another approach for finding the service is to call Info.show_services().
For example, by adding the following line to Calc.set_row_height():
Info.show_services("Cell range for a row", cell_range)
The following is printed in console:
Cell range for a row Supported Services (1)
  "com.sun.star.table.TableRow"
Back in _add_garlic_label(), text is stored in the cell, and its properties set.
Although XMergeable changes a cell range into a cell, it doesn’t return a reference to that cell.
It can be accessed by calling Calc.get_cell():
sheet.get_cell(col=0, row=empty_row_num)
The various cell properties changed in add_garlic_label() are inherited from different classes shown in Fig. 193.

CharWeight and CharHeight come from CharacterProperties, and CellBackColor, HoriJustify, and VertJustify from CellProperties.
Back in`` main()``, the newly created label is hidden after an interval of 2 seconds:
# in GarlicSecrets.main() of garlic_secrets.py
Lo.delay(2_000)  # wait a bit before hiding last row

row_range = sheet.get_row_range(idx=empty_row_num)
row_range.is_visible = False
# ...
Row invisibility requires a property change to the row.
The row’s cell range is obtained by calling `` sheet.get_row_range()`` that invokes Calc.get_row_range(), and then the IsVisible property is switched off.
Finding the name of this property involves the same investigative skills as the search for Height in Calc.set_row_height().
As with Height, IsVisible is defined in the TableRow service.
23.6 Splitting a Window into Two View Panes
The produce sales data is quite lengthy, so it’s useful to split the window into two view panes: one showing the modified rows at the end, and the other the first few rows at the top of the sheet.
The first attempt at splitting the sheet is shown in Fig. 194.
The division occurs just above row 4999, drawn as a thick dark gray line.

Fig. 194 :Two Views of the Sheet.
The code in main() of garlic_secrets.py for this:
# in garlic_secrets.py
# ...
# split window into 2 view panes
cell_name = sheet.get_cell(col=0, row=empty_row_num - 2).get_cell_str()
print(f"Splitting at: {cell_name}")
# doesn't work with Calc.freeze()
Calc.split_window(doc=doc, cell_name=cell_name)
# ...
doc.split_window() invokes Calc.split_window() that can utilize the SpreadsheetView service (see Fig. 189), and its XViewSplitable interface:
controller = Calc.get_controller(doc)
viewSplit = Lo.qi(XViewSplitable, controller);
Unfortunately, XViewSplitable only offers a splitAtPosition() method which specifies the split location in terms of pixels.
In addition, the interface is deprecated.
A better alternative is to employ the splitWindow dispatch command, which has a ToPoint property argument for a cell name (i.e. A4999) where the split will occur.
Therefore, Calc.split_window() is coded as:
# in Calc class
@classmethod
def split_window(cls, doc: XSpreadsheetDocument, cell_name: str) -> None:
    frame = cls.get_controller(doc).getFrame()
    cls.goto_cell(cell_name=cell_name, frame=frame)
    props = Props.make_props(ToPoint=cell_name)
    Lo.dispatch_cmd(cmd="SplitWindow", props=props, frame=frame)
The call to Calc.goto_cell() changes the on-screen active cell.
If it’s left out then the SplitWindow dispatch creates a split at the currently selected cell rather than the one stored in the ToPoint property.
In other words, it appears that the SplitWindow dispatch ignores the property.
Fig. 194 shows another problem with the split - the top pane still shows the rows of data immediately above the split line. The preference is for the top view to show the first rows at the start of the sheet.
One way of changing the displayed rows is via the view’s XViewPane interface (see Fig. 189).
Each view (or pane) created by a split is represented by an XViewPane object, and a collection of all the current panes can be accessed through the SpreadsheetView service.
This approach is implemented in Calc.get_view_panes(), which returns the collection as an array:
# in Calc class (simplified)
@classmethod
def get_view_panes(cls, doc: XSpreadsheetDocument) -> List[XViewPane] | None:
    con = Lo.qi(XIndexAccess, cls.get_controller(doc))
    if con is None:
        raise MissingInterfaceError(XIndexAccess, "Could not access the view pane container")

    panes = []
    for i in range(con.getCount()):
        try:
            panes.append(Lo.qi(XViewPane, con.getByIndex(i)))
        except UnoException:
            Lo.print(f"Could not get view pane {i}")
    if len(panes) == 0:
        Lo.print("No view panes found")
        return None
    return panes
Calc.get_view_panes() is called like so:
panes = Calc.get_view_panes(doc)
print(f'No of panes: {len(panes)}')
The XViewPane interface has methods for setting and getting the visible row and column in the view. For example, the first pane can be made to show the first row, by calling:
panes[0].setFirstVisibleRow(0)
23.7 View States, and Making the Top Pane Active
The previous section split the window into two panes, and changed the view in the top pane to show the first rows of the sheet. But there’s still a problem which can be seen in Fig. 194 - the active cell is still in the bottom pane, and I want it to be in the first row of the top pane. More coding is required.
Hidden away in the XController interface are the methods getViewData() and restoreViewData().
They allow a programmer to access and change the view details of all the sheets in the document.
For example, the following retrieval of the view data for a document:
ctrl = Calc.get_controller(doc) # XController
print(ctrl.getViewData())
Prints:
100/60/0;0;tw:270;3/13/0/0/0/0/2/0/0/0/1;5/15/0/0/0/0/2/0/0/0/0;0/0/0
/0/0/0/2/0/0/0/0
This can be better understood by separating the data according to the ;’s, producing:
100/60/0
0
tw:270
3/13/0/0/0/0/2/0/0/0/1
5/15/0/0/0/0/2/0/0/0/0
0/0/0/0/0/0/2/0/0/0/0
The first three lines refer to the document’s zoom settings, the active sheet index, and the position of the scrollbar. The fourth line and below give the view state information for each sheet. In the example document, there are three sheets, so three view state lines.
Each view state consists of 11 values, separated by /’s. Their meaning, based on their index positions:
indices
0and1contain the current cursor position in terms of column and row positions;2: this records if column split mode is being used (0or1);3: is row split mode being used? (0or1);4: the vertical split position (in pixels);5: the horizontal split position (in pixels);6: the active/focused pane number for this sheet;7: the left column index of the left-hand panes;8: the left column index of the right-hand panes;9: the top row index of the upper panes;10: the top row index of the lower panes.
A sheet can be split horizontal and/or vertically, which can generate a maximum of four panes, which are numbered as in Fig. 195.

Fig. 195 :The Four Panes in a Split Window.
If a window is split only horizontally, then numbers 0 and 1 are used. If the split is only vertical, then the numbers used are 0 and 2.
Only one pane can be active (i.e. have keyboard focus) at a time.
For example, in Fig. 195, pane 1 is active.
The active pane number is stored in view state index 6.
The view state information at index positions 7 to 10 define the top-left corners of each pane.
For example, since pane 1 is in the top-right of the sheet, its top-left corner is obtained by combining the values in view state index positions 8 and 9.
Position 8 supplies the column index of the two right-hand panes, and position 9 the row index of the top two panes.
If a sheet is not split at all, then its top-left corner is reconstructed by accessing index positions 7 and 10.
Although it’s possible for a programmer to extract all this information from the view data string by themselves,
OooDev implemented a support class called ViewState which stores the data in a more easily accessible form.
Calc.get_view_states() parses the view data string, creating an array of ViewState objects, one object for each sheet in the document.
For example, the following code is in garlic_secrets.py:
# in garlic_secrets.py
# ...
# show sheet states
    states = Calc.get_view_states(doc=doc)
    for s in states:
        s.report()
# ...
When it’s executed after the sheet has been split as shown in Fig. 194, the following is printed:
Sheet View State
  Cursor pos (column, row): (0, 4998) or 'A4999'
  Sheet is split horizontally at 259
  Number of focused pane: 2
  Left column indicies of left/right panes: 0 / 0
  Top row indicies of upper/lower panes: 0 / 4998
One view state is reported since the document only contains one sheet. The output says that the sheet is split vertically, and the lower pane is active (in focus).
Calc.get_view_states() is implemented as:
# in Calc class
@classmethod
def get_view_states(cls, doc: XSpreadsheetDocument) -> List[mViewState.ViewState] | None:
    ctrl = cls.get_controller(doc)

    view_data = str(ctrl.getViewData())
    view_parts = view_data.split(";")
    p_len = len(view_parts)
    if p_len < 4:
        Lo.print("No sheet view states found in view data")
        return None
    states = []
    for i in range(3, p_len):
        states.append(mViewState.ViewState(view_parts[i]))
    return states
The first three entries in the view data (i.e. the document’s zoom, active sheet, and scrollbar position) are discarded, so only the document’s view states are stored.
Paired with Calc.get_view_states() is Calc.set_view_states() which uses an array of ViewState objects to update the view states of a document.
It is coded as:
# in Calc class
@classmethod
def set_view_states(
    cls, doc: XSpreadsheetDocument, states: Sequence[mViewState.ViewState]
) -> None:
    ctrl = cls.get_controller(doc)
    if ctrl is None:
        return
    view_data = str(ctrl.getViewData())
    view_parts = view_data.split(";")
    p_len = len(view_parts)
    if p_len < 4:
        Lo.print("No sheet view states found in view data")
        return None

    vd_new = []
    for i in range(3):
        vd_new.append(view_parts[i])

    for state in states:
        vd_new.append(str(state))
    s_data = ";".join(vd_new)
    Lo.print(s_data)
    ctrl.restoreViewData(s_data)
A new view data string is constructed, and loaded into the document by calling XController.restoreViewData().
The string is composed from view state strings obtained by calling ViewState.to_string() for each ViewState object.
Also, the existing values for the document’s zoom, active sheet, and scrollbar position are copied over unchanged by extracting their current values from a call to XController.getViewData().
Finally the active pane is able to be changed to be the top view. Also move the view in that newly activated pane to the top of the sheet:
# in garlic_secrets.py
# ...
states = doc.get_view_states()

# make top pane the active one in the first sheet
states[0].move_pane_focus(dir=ViewState.PaneEnum.MOVE_UP)
doc.set_view_states(states=states)
# move selection to top cell
sheet.goto_cell(cell_name="A1")

# show revised sheet states
states = doc.get_view_states()
for s in states:
    s.report()
The view states are obtained by calling doc.get_view_states() which invokes Calc.get_view_states().
The states list will hold one ViewState object for each sheet in the document, so by using states[0] the panes in the first sheet will be affected.
ViewState.move_pane_focus(), which is described shortly, changes the focus to the top pane.
Finally, the modified view states are written back to the document by Calc.set_view_states().
Fig. 196 shows the outcome of this code: the active cell is now in the top pane, at cell A1.

Fig. 196 :A Changed Active Cell and Pane.
The code fragment above also prints out the revised view state, which is:
Sheet View State
  Cursor pos (column, row): (0, 0) or 'A1'
  Sheet is split horizontally at 259
  Number of focused pane: 0
  Left column indicies of left/right panes: 0 / 0
  Top row indicies of upper/lower panes: 0 / 4998
ViewState.move_pane_focus() changes one value in the view state - the focused pane number (index no. 6 in the list given earlier).
OooDev does not to implement this by having the programmer supply a pane number (i.e. 0, 1, 2, or 3 as shown in Fig. 195)
since these numbers may not all be used in a given split. Instead the focus change is specified in terms of a direction, as shown in the code:
# in viewState class
def move_pane_focus(self, dir: int | ViewState.PaneEnum) -> bool:
    try:
        d = ViewState.PaneEnum(dir)
    except Exception:
        raise ValueError("Unknown move direction")

    if d == ViewState.PaneEnum.MOVE_UP:
        if self._pane_focus_num == 3:
            self._pane_focus_num = 1
        elif self._pane_focus_num == 2:
            self._pane_focus_num = 0
        else:
            Lo.print("cannot move up")
            return False
    elif d == ViewState.PaneEnum.MOVE_DOWN:
        if self._pane_focus_num == 1:
            self._pane_focus_num = 3
        elif self._pane_focus_num == 0:
            self._pane_focus_num = 2
        else:
            Lo.print("cannot move down")
            return False
    elif d == ViewState.PaneEnum.MOVE_LEFT:
        if self._pane_focus_num == 1:
            self._pane_focus_num = 0
        elif self._pane_focus_num == 3:
            self._pane_focus_num = 2
        else:
            Lo.print("cannot move left")
            return False
    elif d == ViewState.PaneEnum.MOVE_RIGHT:
        if self._pane_focus_num == 0:
            self._pane_focus_num = 1
        elif self._pane_focus_num == 2:
            self._pane_focus_num = 3
        else:
            Lo.print("cannot move right")
            return False
    return True
See also
23.8 Adding a New First Row and Shifting Cells
The final task in garlic_secrets.py is to add the Top Secret Garlic Changes text to the sheet again, this time as a visible title for the spreadsheet.
The only new API feature used is the insertion of a row. This is done with:
# in garlic_secrets.py
# ...
# add a new first row, and label that as at the bottom
sheet.insert_row(idx=0)
self._add_garlic_label(sheet=sheet, empty_row_num=0)
# ...
The _add_garlic_label() method is unchanged from earlier, but is now passed row index 0 rather than the last row.
The result is shown in Fig. 197.

Fig. 197 :The Sheet with a New Title Row.
`` sheet.insert_row()`` invokes Calc.insert_row() that manipulates a row as a cell range, so it’s once again necessary to access the sheet’s XColumnRowRange interface, to retrieve a TableRows object.
The XTableRows interface supports the adding and removal of rows at specified index positions.
This allows Calc.insert_row() to be coded as:
# in Calc class (simplified)
@staticmethod
def insert_row(sheet: XSpreadsheet, idx: int) -> bool:
    cr_range = Lo.qi(XColumnRowRange, sheet, True)
    rows = cr_range.getRows()
    rows.insertByIndex(idx, 1)  # add 1 row at idx position
    return True
See also
There’s a similar Calc.insert_cols() method that utilizes the XTableColumns interface:
# in Calc class (simplified)
@staticmethod
def insert_column(sheet: XSpreadsheet, idx: int) -> bool:
    cr_range = mLo.Lo.qi(XColumnRowRange, sheet, True)
    cols = cr_range.getColumns()
    cols.insertByIndex(idx, 1)  # add 1 column at idx position
    return True
See also
The insertion of an arbitrary number of blank cells into a sheet is a bit more complicated because existing cells must be ‘moved’ out of the way, and this can be done by moving them downwards or to the right. The shift-able cells are specified as a cell range, and the sheet’s XCellRangeMovement interface moves them in a specific direction. XCellRangeMovement is supported by the Spreadsheet service.
The Calc.insert_cells() method implements this approach:
# in Calc class (simplified)
@classmethod
def insert_cells(cls, sheet: XSpreadsheet, cell_range: XCellRange, is_shift_right: bool) -> bool:
    mover = mLo.Lo.qi(XCellRangeMovement, sheet, True)
    addr = cls.get_address(cell_range)
    if is_shift_right:
        mover.insertCells(addr, CellInsertMode.RIGHT)
    else:
        mover.insertCells(addr, CellInsertMode.DOWN)
    return True
See also
An example call:
blanks = Calc.get_cell_range(sheet=sheet, range_name="A4999:B5001")
Calc.insert_cells(sheet=sheet, cell_range=blanks, is_shift_right=True)  # shift right
This shifts the last three rows of the produce sheet A4999:B5001 to the right by two cells, producing Fig. 198.

Fig. 198 :Shifted Cells at the end of the Produce Sheet.